AI displacement risk and corporate credit spreads
This project links public labor-exposure logic to an issuer-month credit research pipeline without publishing licensed bond observations. Cross-sectional, event, rating-controlled, and alternative-exposure specifications test whether workforce displacement risk is reflected in spreads and retain the statistically restrained conclusion.
Industry automatability × firm labor intensity.
Research premise
Follow the risk shadow into bond prices
Does the risk that AI automates an issuer's workforce show up in the price of its bonds?
The same industry pressure can matter differently across firms. The opening scene follows that variation from workforce exposure into one deliberately bounded bond-market test.
Whether issuers with greater measured AI displacement exposure tend to carry wider credit spreads.
Whether AI will eliminate specific jobs, impair a specific issuer, or causally raise its borrowing cost.
Answer first
Across 344 non-financial issuers from 2015 to 2026, the point estimates lean toward wider spreads with greater exposure, but the headline specifications are not conventionally significant.
Boundary. The rating-controlled cross-section is only marginally significant at about 14 basis points (p = 0.086), and the exposure measure remains a proxy for cash flows at risk from automation.
Exposure design
Turn industry risk into issuer variation
The proxy combines a common industry pressure with the firm characteristic that determines how strongly that pressure could matter.
Interpret carefullyThe interaction creates within-industry firm variation. It represents cash flows potentially at risk from automation, not observed displacement and not a forecast of realized job losses.
Sample construction
From 7,190 bonds to a defensible panel
The investable-looking bond universe becomes much smaller once securities are mapped to ultimate parents and matched to usable issuer fundamentals.

Sample funnel from 7,190 corporate bonds to 344 non-financial issuers and 22,414 issuer-month observations. Public AI Credit Risk working paper.
Text equivalent
Sample construction begins with 7,190 USD senior unsecured corporate bonds, maps them to 1,391 ultimate parents, retains 679 non-financial issuers with required fundamentals, and ends with 344 issuers and 22,414 issuer-month observations from 2015–2026.
The final panel contains 344 non-financial issuers and 22,414 issuer-month observations. The funnel is part of the result: it makes the distance between raw availability and analytical coverage visible.
Research design
Build the estimate without hiding the joins
Mapping, measurement, and specification stress tests are treated as one auditable pipeline.
Issuer-month credit panel
Eligible USD senior unsecured bonds are mapped through ultimate parents and aggregated into a 2015–2026 panel of 344 non-financial issuers.
Exposure construction
Industry automatability is interacted with firm labor intensity to introduce within-industry variation while keeping the measure interpretable as a proxy.
Specification stress tests
Baseline, event, triple-difference, clustered, rating-controlled, and US exposure variants preserve point estimates and uncertainty side by side.
Data integrity
Make impossible observations visible
Extreme raw spread errors can dominate an estimate long before the economic question is reached.
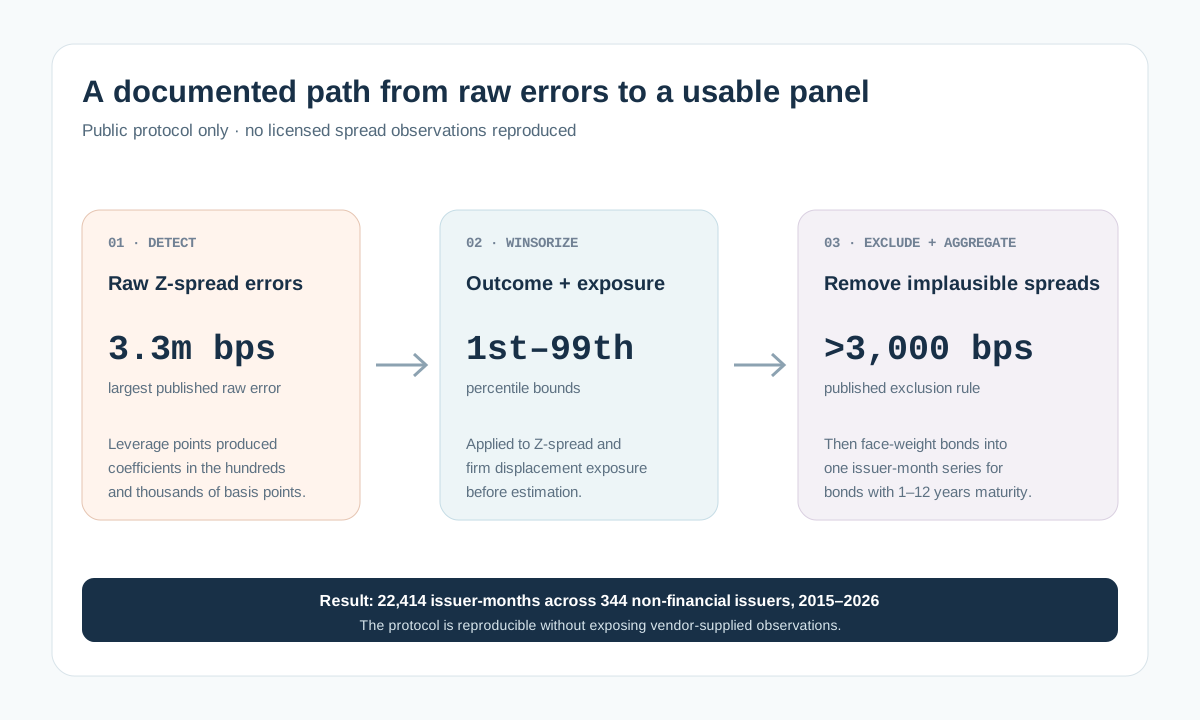
Research pipeline showing how extreme raw Z-spread errors are winsorized and observations above 3,000 basis points are removed. Public AI Credit Risk working paper.
Text equivalent
Raw Z-spread errors reached 3.3 million basis points. The public cleaning protocol winsorizes Z-spread and displacement exposure at the 1st and 99th percentiles, removes spread observations above 3,000 basis points, and then aggregates eligible bonds to an issuer-month series.
Cleaning is a modelling decisionRaw errors reached 3.3 million basis points. Winsorisation and the 3,000-basis-point exclusion rule are disclosed because a clean chart is only credible when the route from raw input remains inspectable.
Specification evidence
Seven estimates lean the same way
The sign is consistently positive; the uncertainty is consistently too large for a strong pricing claim.
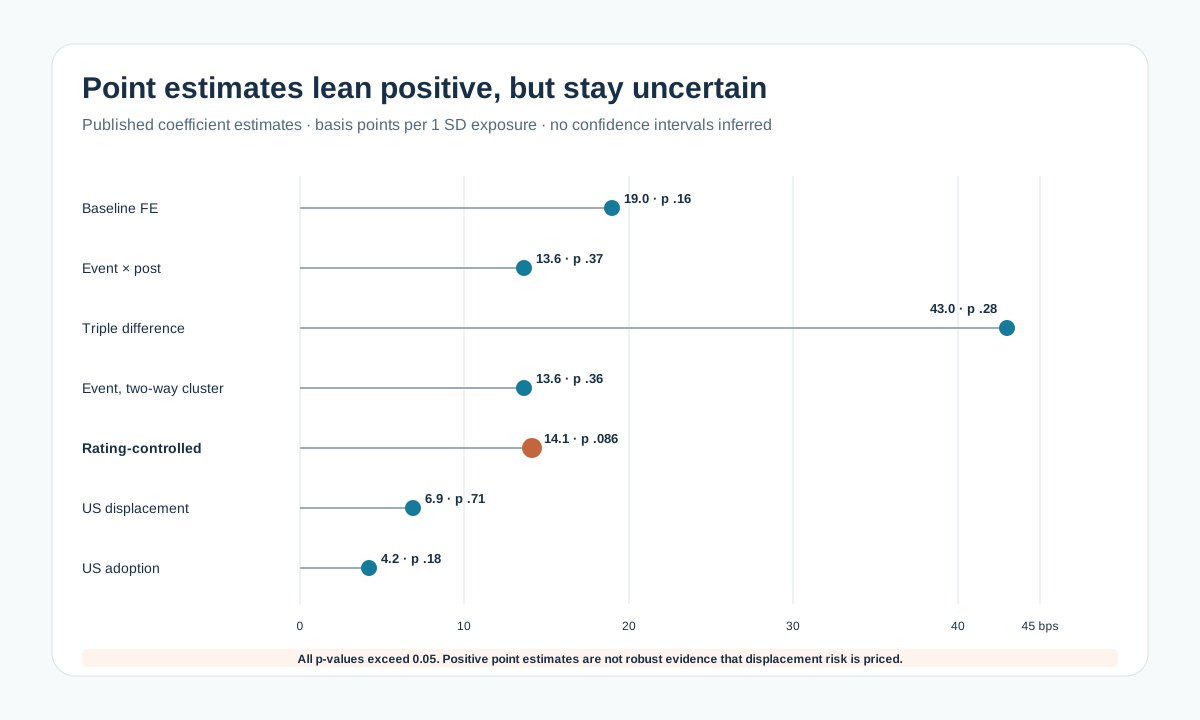
Point-estimate plot showing positive but conventionally insignificant AI displacement coefficients across seven corporate credit specifications. Public AI Credit Risk working paper.
Text equivalent
Basis-point estimates / p-values: baseline 19.0 / 0.16; event 13.6 / 0.37; triple difference 43.0 / 0.28; event with two-way clustering 13.6 / 0.36; rating-controlled 14.1 / 0.086; US displacement 6.9 / 0.71; US adoption 4.2 / 0.18. All shown estimates are positive, but none is significant at five percent.
The baseline estimate is about 19 basis points per standard deviation of exposure (p = 0.16). Rating controls reduce it to about 14 basis points (p = 0.086). Directional consistency is suggestive, not decisive.
Interpretation
A research signal, not a priced-risk verdict
A restrained conclusion preserves both the recurring positive sign and the failure to reach conventional significance.
Across 344 non-financial issuers from 2015 to 2026, the point estimates lean toward wider spreads with greater exposure, but the headline specifications are not conventionally significant.
Verified metrics
- 19 bpBaseline spread estimate
A one-standard-deviation exposure increase is associated with 19 basis points of extra spread, with p = 0.16.
Verify in public source - 14 bpRating-controlled estimate
Adding rating controls lowers the point estimate to about 14 basis points and remains only marginal at p = 0.086.
Verify in public source - 22,414Issuer-month observations
The final public summary describes 344 non-financial issuers observed across the 2015–2026 research window.
Verify in public source
+19 bp point estimate
interval crosses zero
suggestive, not conclusive
Across the tested specifications, higher measured exposure is associated with modestly wider spreads.
The rating-controlled cross-section is only marginally significant at about 14 basis points (p = 0.086), and the exposure measure remains a proxy for cash flows at risk from automation.
Public record
Evidence archive
Licensed observations stay private; the construction logic, reported estimates, and research provenance remain public.
- 01Sample funnel from 7,190 corporate bonds to 344 non-financial issuers and 22,414 issuer-month observationsVerify
Sample construction begins with 7,190 USD senior unsecured corporate bonds, maps them to 1,391 ultimate parents, retains 679 non-financial issuers with required fundamentals, and ends with 344 issuers and 22,414 issuer-month observations from 2015–2026.
- 02Point-estimate plot showing positive but conventionally insignificant AI displacement coefficients across seven corporate credit specificationsVerify
Basis-point estimates / p-values: baseline 19.0 / 0.16; event 13.6 / 0.37; triple difference 43.0 / 0.28; event with two-way clustering 13.6 / 0.36; rating-controlled 14.1 / 0.086; US displacement 6.9 / 0.71; US adoption 4.2 / 0.18. All shown estimates are positive, but none is significant at five percent.
- 03Research pipeline showing how extreme raw Z-spread errors are winsorized and observations above 3,000 basis points are removedVerify
Raw Z-spread errors reached 3.3 million basis points. The public cleaning protocol winsorizes Z-spread and displacement exposure at the 1st and 99th percentiles, removes spread observations above 3,000 basis points, and then aggregates eligible bonds to an issuer-month series.